Retention is King, But Are You Tracking the Right Metric?
The slope of the retention curve is the most important metric to monitor. Without flat retention it becomes very difficult to grow at…
I offer consulting services and can help you think through challenges surrounding growth strategy, pricing, retention, unit economics, and more. Learn more.
There is perhaps no more important metric for any business than retention. However, retention metrics are easy to mis-define and can lead teams in the wrong direction when defined incorrectly. One of the biggest mistakes I see is companies that focus on reporting static annual retention figures (e.g. month-12 retention) without taking into consideration the slope of the retention curves. In this post, I’ll illustrate why you’ll never be able to grow at scale if your retention curves don’t flatten.
Which Company Below Has Better Retention?
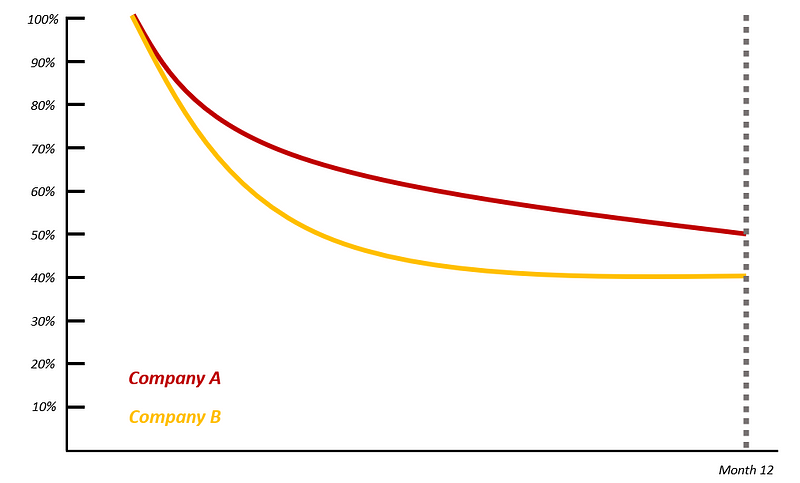
Company A retains 50% of users after the first 12 months while Company B retains only 40%. I wrote a post previously that benchmarked month-12 retention. Company A is in the ~70th percentile while Company B is closer to the 40th percentile. Which company has better retention? It is obvious right? Company A?
Let’s dig deeper. Below is an illustration of the retention curves. Company A clearly retains a higher percentage of its users. Still obvious, right?
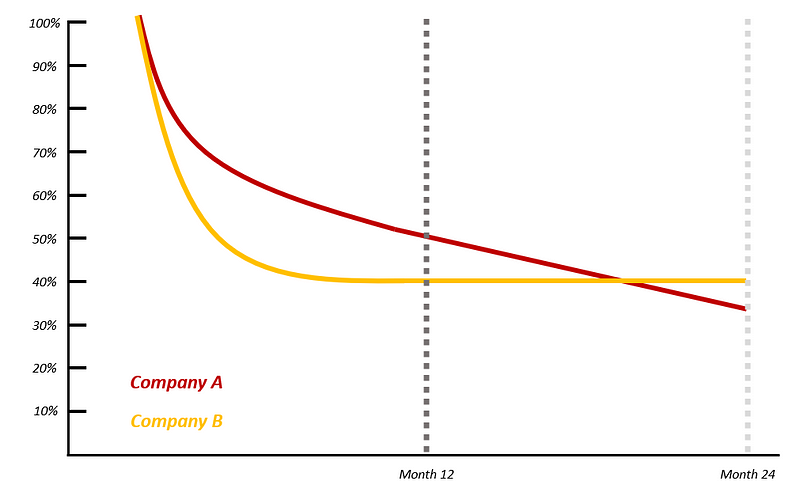
Well, in order to correctly answer this question, it is important to see the full retention picture. When we extend the timeframe (below) and look at the longer term retention curves, it becomes apparent that Company B retains a higher percentage of users. Focusing on annual retention without considering the slope of the retention curve would have been a trap. Company A has a linear decay curve while company B has an exponential decay curve.
Linear decay: probability of churn remains the same over time
Exponential decay: probability of churn decreases over time
The Retention Slope is What Matters
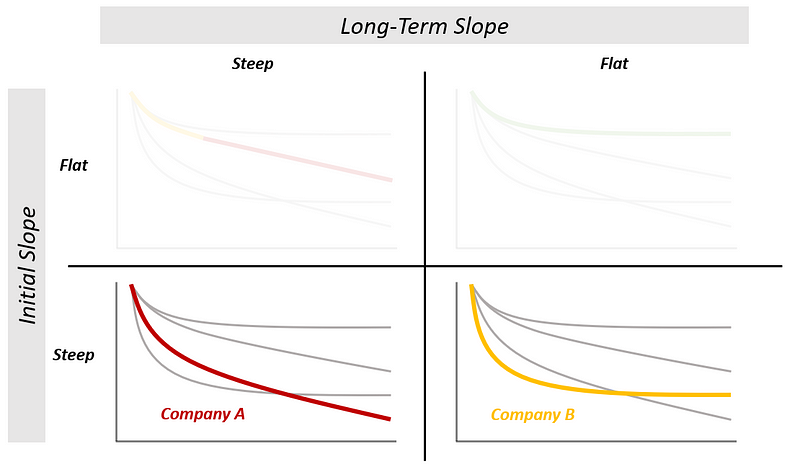
The slope of the retention curve is the most important retention metric to monitor. Retention curves come in all shapes and sizes, but let’s simplify by looking at:
Time: Initial Slope (month 1–3) and Long-Term Slope (month 12+)
Slope: Steep (high churn) and Flat (low churn)
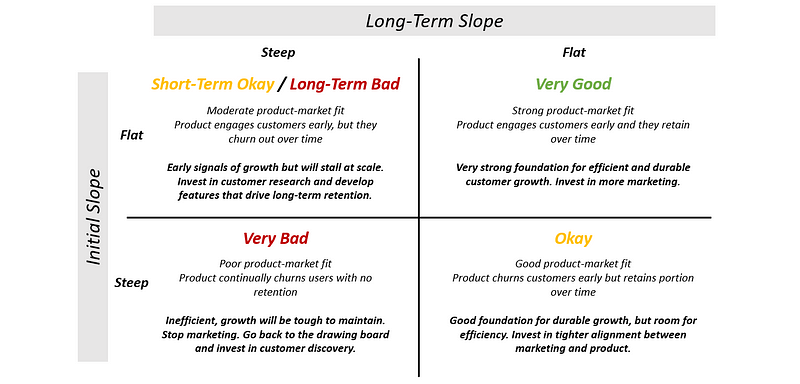
When plotting these dimensions on a 2x2, we come away with four major categories, each of which we’ll explore in depth below. Note that this methodology can be applied to cohorts for any metric (paid retention, DAU, MAU, etc) as long as it is core to growth.
It is rare to have a slope at either the steep or flat extremes. It is most likely that your company’s retention curves fall somewhere in the middle of this 2x2.
It is rare for initial slope to ever be truly flat. When referring to flat initial slope it is likely to have some level of decay in month 1.
In some rare cases you might see “smiling” retention curves where the retention slope turns positive. Enterprise companies also benefit from net-negative churn where spend expands over time.
Flat(tish) Initial Slope, Flat Long-Term Slope — Very Good
Companies in the top-right quadrant have very strong product-market fit. The product engages customers early in their lifecycle and they retain over the long-term. This sets a very strong foundation for efficient growth. Companies that find themselves here should invest aggressively into marketing! Go!
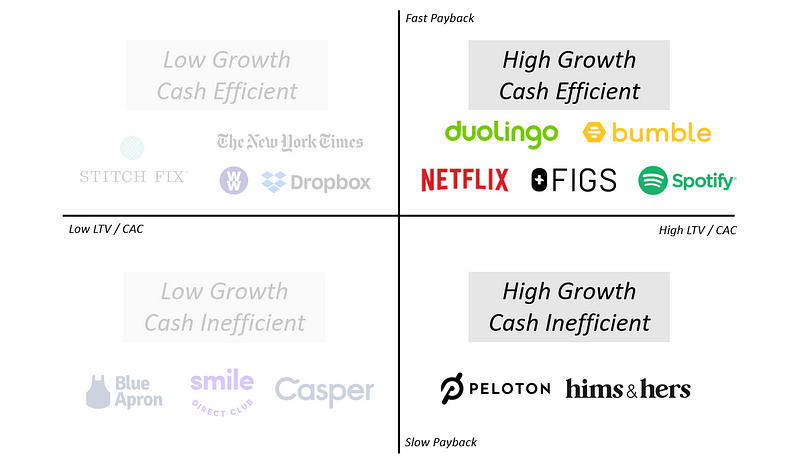
I previously wrote a post on the importance of CAC payback. Companies that find themselves in the high growth quadrants below often have flat long-term retention curves. We’ll show this clearly in an illustration later.
As a specific example, you can Spotify’s retention curves show very strong flattening retention dynamics, with the company retaining over 70% of users after the first 12 months. There is a natural dip after month 1, but then Spotify retains 90% of users over the next 11 months.

Steep Initial Slope, Flat Long-Term Slope — Okay
Companies in the bottom-right quadrant have good product-market fit. The product churns through customers early in the lifecycle but a percentage of customers stick around for the long-term. The higher the level at which the curve flattens, the higher the long-term retention and the healthier the product. While it is not ideal to have a steep initial slope, the fact that the long-term slope flattens sets a foundation for long-term growth. However, there is room for efficiency.
If your curves fall in this quadrant, the most critical metric to monitor is the level of retention at which the curve flattens. If the retention curve flattens at a low level of less than 30% retention, it will take time to grow. This places more pressure on acquisition to drive growth and at very low levels of 10–20% retention, growth might become challenging. High churn may also make it prohibitively expensive to acquire customers. If your company has retention curves like this:
Understand why some customers are churning early and others are not
Invest in tighter alignment between product and marketing so the customers you acquire are the right fit for your product. The steeper the initial slope, the bigger the disconnect is between marketing and product.
Invest in onboarding and activating users early in their journey (a-ha moment)
While the goal is to be like Spotify and have flat curves immediately at 70%+ retention, a realistic, yet ambitious goal is to have the curves flatten within the first 12 months, stabilizing at over 50%. This represents the top quartile of retention.
Flat(tish) Initial Slope, Steep Long-Term Slope — Short-Term Okay / Long-Term Bad
Companies in the top-left quadrant are in a tough spot. The product is engaging early in the user lifecycle, but users churn out over time, demonstrating a linear decay curve. Something is working but only for a short time. Unfortunately, companies with a steep long-term retention slope simply will not be able to grow at scale as there is no foundation for growth. The trap of being in this quadrant is that there will be early signs of growth due to good early retention, but growth will inevitably stall. If your company has retention curves like this:
Invest in customer research to better understand why all your customers churn over time. Is it due to lack of marginal utility as time goes on, price, lack of product/model fit, lack of a true habit-forming loop?
Consider how network effects (user / data) can create more value for users the longer they engage with your product
Spend time developing new growth engines. If you’re in this quadrant, growth will start to taper before you know it. Starting to think about your next product generation when sales are starting to flatten is way too late.
The good news is that something is working early on. Understanding customer pain points will enable you to develop features that will drive more continuous long-term usage and keep these users around. The key here however is to be patient. Retention curves never change overnight.
Steep Initial Slope, Steep Long-Term Slope — Very Bad
Uh oh! Companies in the bottom-left quadrant lack product-market fit. The product is not engaging and users churn out immediately, making growth nearly impossible. If your company’s retention curve looks like this, stop marketing! Go back to the drawing board and invest in customer discovery and improve your product.
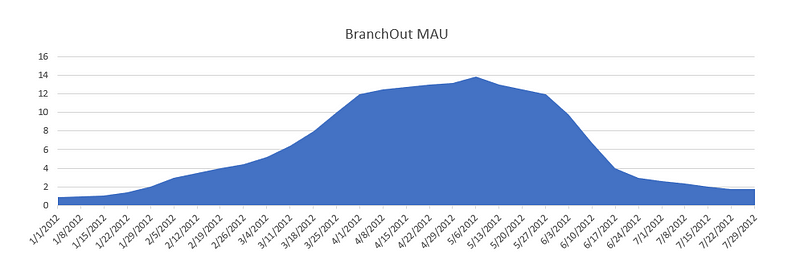
See below the cautionary tale of BranchOut, a professional social-network built on Facebook. In a few months, growth spiked to 14 million MAU. The company incentivized users to spam their friends, saturating Facebook with invites. People joined initially but found little to no value in the product. Growth soon cratered. The effort put into new user acquisition was wasted as they were pouring water into a “leaky bucket”. This is an aggressive case but an important one to highlight lack of product-market fit. Here’s a popular post I’ve written on the topic.
There are several exceptions to the four quadrants above but generally the illustrations hold true. For example, dating apps have high churn but strong product-market fit. Other companies have poor retention but can grow efficiently due to high organic traffic. These companies can remain profitable even if growth is challenging. It is also worth noting that these are general guidelines. Retention curves come in all shapes and sizes and fit somewhere in between.
Putting This Into Practice With Data
Let’s go back to the Company A and Company B example from above. I’ll illustrate the phenomenon with hard data so you get the whole picture.
To do so, let’s make a few simple assumptions:
Both Company A and Company B acquire 10,000 users per month starting in January 2023
Company B retention flattens at 40% after month 12 while Company A slowly decays from 50% after month 12 by 4–5% per month
Properly understanding retention requires taking a long-term view so let’s go out to 2028
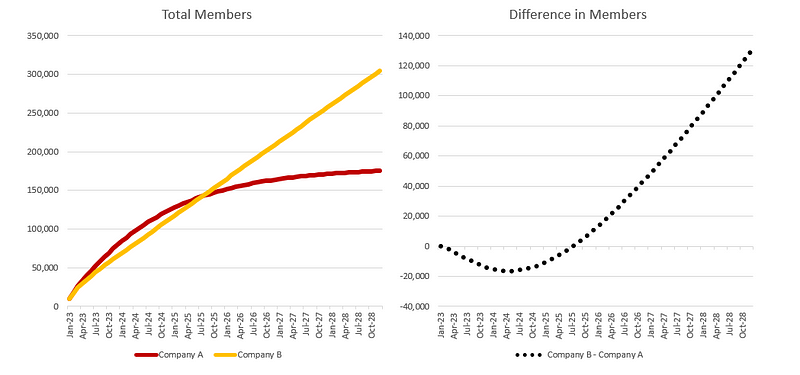
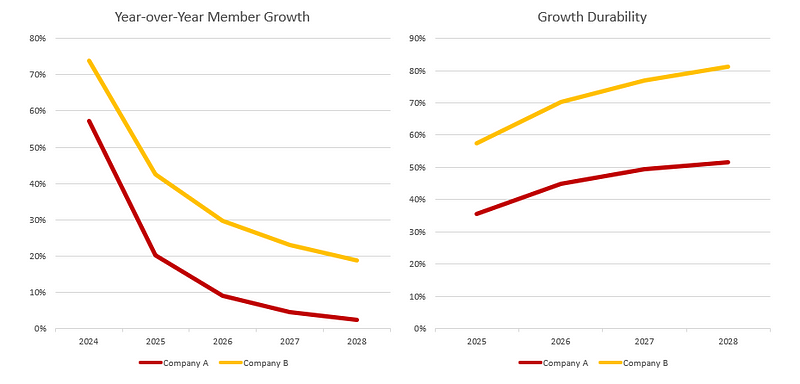
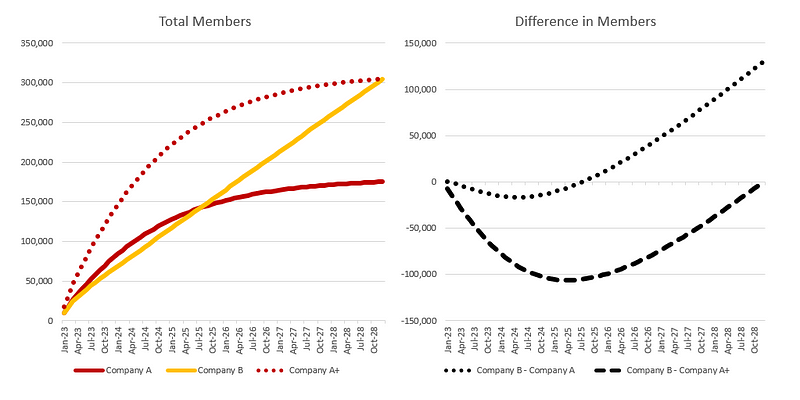
Initially, Company A will be growing faster due to the higher initial month 12 retention, but by mid 2025, things change. And as time goes on, Company A starts to face a tremendous amount of pressure on growth.
By the end of 2028, even though both companies have acquired the same number of users (10K * 72 months = 720K users), Company B is almost 75% larger in scale. Not only this, Company B is growing significantly faster while Company A’s growth has almost entirely stalled out. This company has hit a brick wall of an S-Curve (read more here in a prior post).
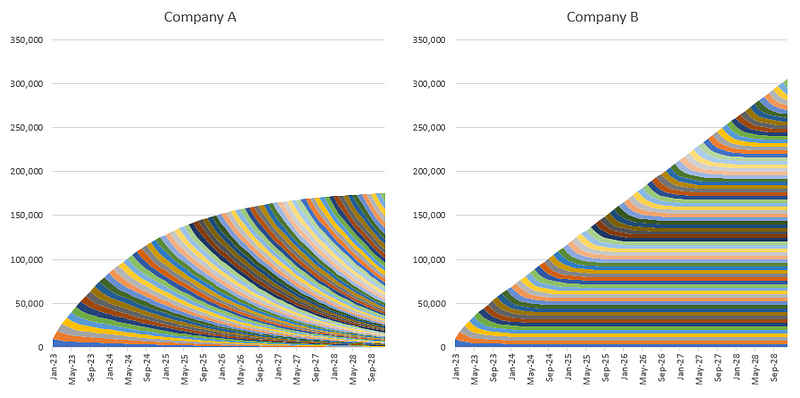
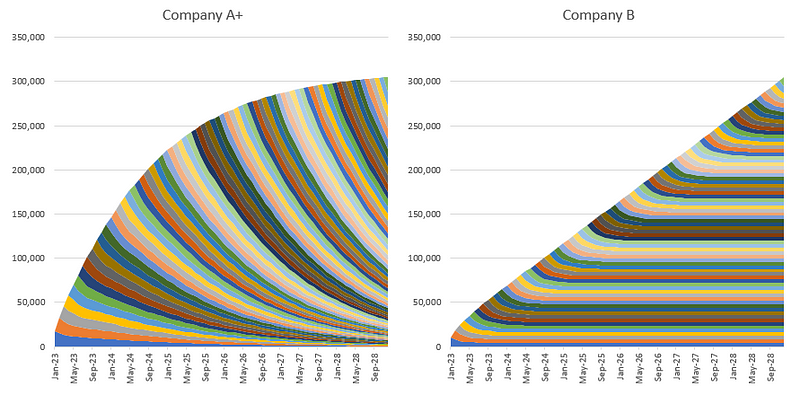
Why is this happening? If we look underneath the hood, we’ll see that Company B’s flat cohort curves provide a healthy foundation of users to build on. However, with Company A, when we stack retention curves of cohorts where retention doesn’t flatten, the overall growth trends towards stalling. The compounding nature of churn is making it hard for Company A to grow.
Due to the stronger retention dynamics, Company B is rewarded with stronger growth rates and growth durability. Growth durability refers to the rate of change of the growth rate. For example, Company B’s growth durability in 2028 is 81% which is computed by dividing the 2028 growth rate of 18.7% by the 2027 growth rate of 23.0%. This company is less reliant on new acquisition to drive growth and thus is much more predictable (and hint, hint, more valuable).
“But Couldn’t Company A Just Acquire More Users?”
As members churn out and Company A’s growth decays, management will be compelled to spend more in order to super-charge growth. Indeed, Company A can spend more to get to the same member count as Company B in 2028…
… but this growth is quite costly. Let’s look at these three scenarios below to see the full picture. We’ll refer to Company A with increased acquisition as Company A+.
Company A and B both acquired 720K users but by the end of 2028, Company B is significantly larger as it retained a larger portion of its base. It is also growing much faster!
Company A+ ends 2028 with the same number of members as Company B but it had to spend $53M more and churned through an additional 532K+ members to get there. And at the end of the day, it is still only growing 2%!
The trap is that in mid-2025, management of Company A+ is celebrating! It seems like growth is good! 100K more members than Company B. But growth starts to decelerate rapidly. Why? When we look under the hood again it is the same phenomenon. When we stack retention curves of cohorts where retention doesn’t flatten, the overall growth trends towards stalling. This phenomenon compounds on itself the longer view that we take. Seeking growth with weak product-market fit is a fool’s errand…
In 2027/2028, for Company A+ to sustain growth durability with poor retention, management will need to kick marketing back into another gear to acquire even more users. This is like a never-ending hamster wheel. Because of the leaky bucket, this company becomes overly reliant on acquisition to drive growth. But as the company spends more on marketing, CAC will likely increase, making it incredibly expensive and potentially unprofitable to scale. At some point, the formula breaks as you saturate your addressable market… you simply cannot outgrow declining retention.
If there’s ever a pullback in marketing spend or new user acquisition, growth might even turn negative. Remember BranchOut? Other similar examples that come to mind worth studying are SocialCam, Fab, and Homejoy. And one I highlighted in a prior post with a detailed case study is Blue Apron.
In the short term, growth comes from acquisition but in the long term, growth comes from retention
Tangential Benefits of Flattening Retention
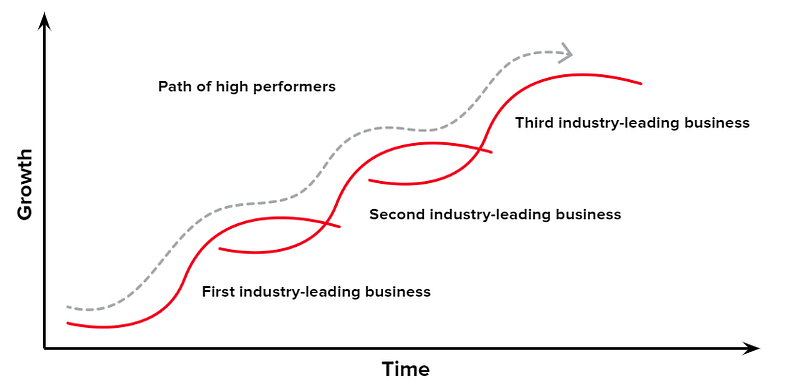
As I have written previously, the highest-performing companies are able to “jump S-curves” by investing in new growth engines. Products with declining retention curves reach a growth plateau quite quickly, putting a lot of pressure on the company to develop new growth engines to cushion of decline of the core engine. Companies that have flattening retention cohorts have a lot more time to develop these new growth engines and thus a lot more margin for error. Other tangential benefits that come with flattening retention include:
Higher lifetime value per member. This means you can spend more on CAC and still hit your target contribution margins.
Improved payback dynamics, which creates cash advantages. This capital can also be re-invested into marketing.
A larger base on which to deploy ARPU expansion and upsell strategies, driving additional revenue and margin opportunities.
More efficient marginal growth. Acquiring a new customer is more expensive than retaining an existing one.
Every percentage that comes out of retention is a percentage that comes out of your company’s growth rate
Final Thoughts
While companies often report annual retention figures, it is more important to monitor the slope of the retention curve over time. If companies are not able to get their long-term retention curves to flatten, member growth will become challenging at scale. One of the biggest organizational challenges is that to understand the impact of retention and prioritize initiatives you need to take a long-term view and be patient— and this often is in conflict with a team’s short-term goals (monthly or quarterly) and the natural human desire for instant gratification.
As noted above, retention curves come in all shapes and sizes. The illustrations above are to help you better understand these concepts. It is very likely that your curves fall somewhere in between the quadrants. Maybe your retention curves are strong but don’t entirely flatten. Or your curves slope downward but then eventually flatten after a long time. It’s up to you to apply these learnings to your business. Most importantly, I hope this post will help demystify why it is so critical to make retention slope a top priority. Good luck!
Bonus Content
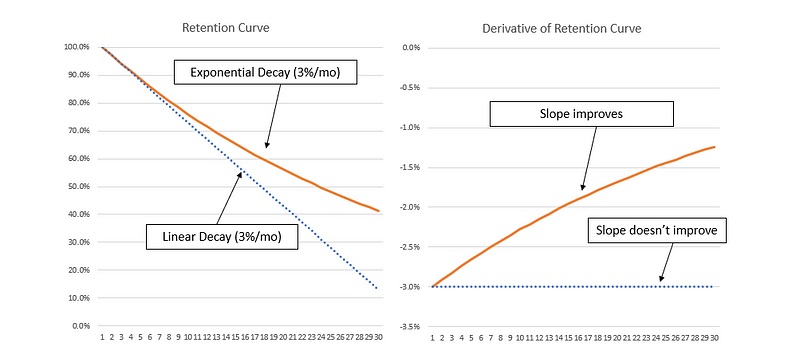
If you want to go a level deeper, you can turn your retention curves into *derivatives* and monitor the curves to see whether they approach 0, which would mean they are flattening. Below, OrangeCo has an exponential decay curve meaning the percent that a member retains decreases at a relative rate of 3% per month. On the other hand, BlueCo has a linear decay curve meaning the percent that a member retains decreases at an absolute rate of 3% per month. When looking at the derivative curves you can clearly see OrangeCo is approaching 0%, meaning its retention curve is slowly flattening. The slope of BlueCo remains constant given the linear nature of the retention decline.
Additional Reading
I referenced several of my prior articles throughout this post which are linked here for ease:
The Importance of CAC Payback in Today’s Market Environment: CAC payback has huge implications on a company’s ability to scale efficiently. Cash efficiency is king.
Jumping S-Curves: Building a High Performance Startup: One of the most important concepts for startup leaders to understand in building a high-performance company is S-curves.
Consumer Subscription KPI Benchmarks: Retention, Engagement, and Conversion Rates: Digital consumer subscription KPI benchmarks and key learnings.
How to Discover Your App’s ‘Aha Moment’: A step-by-step guide on how to define your app’s a-ha moment, the time when a user first realizes the value in your product.
7 Lessons from Andy Rachleff on Product-Market Fit: Key lessons on how to identify product-market fit and some pitfalls to avoid.
Special thanks to several of my colleagues Kim Larsen, Sam Bauman, Caroline Shoemaker, and Amit Bhatt for their contributions to this post.
Interested in going deeper? I offer consulting services and can help you think through challenges surrounding growth strategy, pricing, retention, unit economics, defining your a-ha moment, and more. Learn more.


