Why LTV / CAC Can Be Deceptive — There’s a Better Metric
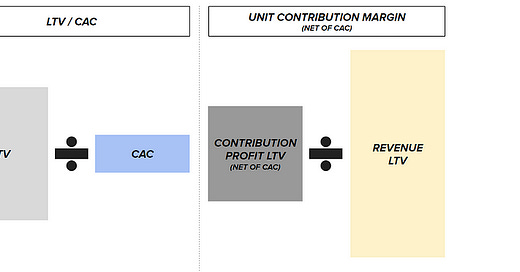
In my previous post on unit economics, I’ve emphasized the importance of the LTV/CAC ratio as a key metric in growth strategy. However, it’s time to address its limitations: LTV/CAC can mislead by oversimplifying a company’s financial health. A more comprehensive and nuanced complement is to focus on unit contribution margin (net of CAC). This approach considers both direct costs and the broader operational context. Together, these two metrics offer a clearer insight into real profitability and financial stability of a company.
Dissecting the Financial Anatomy of a Business
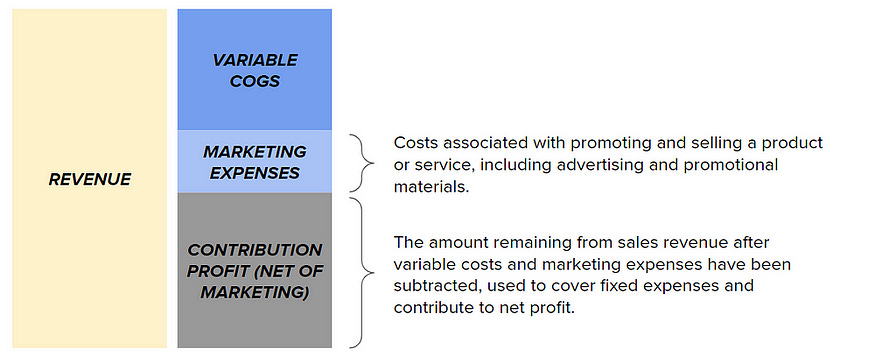
Understanding a business’s financial vitality necessitates an understanding of its cost structure. Below is a very simplistic view that I like to use. Let’s establish this before we dive in.
Revenue and Variable COGS: Revenue is the starting point, but the key metric to focus on is Gross Profit, which is what remains after variable costs associated with production and sales are deducted. Variable costs can include expenses like raw materials and packaging — costs that fluctuate with production volume.
Marketing Expenses: Deducting Marketing Expenses from Gross Profit, we arrive at Contribution Profit (Net of Marketing) which offers a clear picture of what’s contributing to the bottom line, post growth efforts. Note that marketing expenses have both fixed and variable components which we combine together in this exercise.
Fixed Expenses: These are other costs such as rent and salaries, that when subtracted from Contribution Profit (Net of Marketing), leave us with Net Profit. The ultimate goal of a business is to deliver long-term net profits.
What is the Right Margin Structure?
Incorporating all these elements, we can visualize a business’ cost structure. This model accounts for the dynamic interplay between revenue, variable costs, fixed costs, and ultimately profits.
Benchmarking against industry standards for long-term net profit margins (when including fixed costs) is a strategic exercise. As seen below, Internet companies vary widely in their long-term net profit margin guidance, with some targeting high margins of 40% and others aiming for more modest margins around 10%. These targets are not arbitrary; they’re based on nuanced assessments of each company’s operational efficiencies, market positioning, and long-term strategic vision.
A practical guideline for businesses is that their present Contribution Margin, after deducting marketing expenses, should closely align with the long-term net profit margins they aim to realize.
Investors are naturally drawn to companies with higher long-term net margin targets because these companies are adept at capturing value (i.e., converting revenue into profit), a signal of strong cash flow potential, which is a cornerstone of valuation. This is particularly true for SaaS companies, whose business models are characterized by robust gross margins and recurring revenue, leading to predictable and scalable cash flows. It is this capacity for sustained profitability that makes such companies especially attractive to investors.
Leveraging this Framework for Unit Economics
Taking the same concept, let’s reframe these terms by looking at a “per unit” view. If you want a refresher on unit economics, please visit my prior post on the topic. This view is useful as it tells the story of a business’s profitability on a micro-scale, which when aggregated, shapes the macro financial narrative of a business.
Gross Profit → LTV: LTV represents the gross profit a customer contributes over their lifetime. Consider a premium subscription service where customers are retained over years, contributing to a higher LTV due to recurring revenue at high-profit margins.
Marketing Expenses → CAC: Marketing Expenses are viewed as CAC and encapsulate the strategic investment in customer acquisition for each new user.
Two Lenses to Understand Unit Economics
The evaluation of marketing spend efficiency can be approached through two lenses:
LTV/CAC Ratio: This indicates the value a customer brings relative to acquisition costs. Typically a strong return is above ~3x.
Contribution Margin (Net of CAC): This comprehensive metric accounts for the full cost structure, shining a light on enduring profitability.
Unit Contribution Margin (Net of CAC) offers a distinct advantage over LTV/CAC ratios by incorporating the entire cost structure of a business. It provides a more transparent view of profitability by considering how different aspects of the business contribute to the bottom line. The per-unit contribution margin ultimately cascades through the business. By embracing these two metrics together, businesses can ensure they’re not just spending efficiently, but growing wisely and profitably, with a keen eye on all expenses that affect their financial trajectory.
Putting it Into Practice with an Example
Let’s compare two businesses, both with a 3x LTV/CAC ratio. The surface-level interpretation might suggest they are equally efficient in terms of customer acquisition costs relative to the customer lifetime value. However, the stark contrast in their unit contribution margins (net of CAC) — 40% versus 13% — tells a story of vastly different operational efficiencies and potentially different business models.
For Company A with 40% unit contribution margins (net of CAC) the high margin suggests that after accounting for variable and marketing costs, they retain a substantial amount of revenue that contributes to fixed costs and profits. This could imply a strong value proposition, pricing power, efficient cost management, or a combination of these factors. The strategic questions here would focus on how to leverage this strong margin to fuel growth.
Can they invest more in marketing to further accelerate growth?
Is there room for expansion into new markets or product lines (R&D), given the cushion their profitability provides?
Conversely, Company B with 13% unit contribution margins (net of CAC) is operating on a much tighter financial leash. Despite having the same LTV/CAC ratio, the lower margin indicates that after covering the variable and marketing costs, there’s significantly less margin left over to cover fixed costs and contribute to profits. This raises a set of different strategic questions:
Are there opportunities to reduce costs or increase prices to improve margins?
Should the company focus on increasing the efficiency of its operations or potentially look at adjusting its business model to ensure sustainability?
Both businesses may look similar from an LTV/CAC perspective, but their contribution margins (net of CAC) paint a more detailed picture of their financial health and strategic imperatives. The company with higher margins may have more flexibility and opportunities for growth, while the one with lower margins needs to scrutinize its cost structure and find ways to improve its bottom line.
Casper: Case Study
To show a real-life example, Casper’s financial conundrum, as depicted in detail below, is telling. The mattress company’s long product replacement cycle contributed to low repeat rates, meaning their substantial customer acquisition costs weren’t offset by repeat purchases. In fiscal 2020, the marketing spend was excessively high at over 30% of total revenue, reflecting a cost structure that was not sustainable given their business model.
The LTV/CAC ratio at 1.4x was not strong enough to suggest a healthy marketing ROI. Despite achieving a gross margin of 51%, the unit contribution margin (net of CAC) stood at a modest 15%, suggesting that after all variable costs were taken into account, there wasn’t a significant enough profit left to cover fixed expenses.
Analysts pointed out the limited profit potential, noting that despite Casper’s ambitious vision, the company struggled to navigate the economics of its business to turn a profit. Given the company’s negative operating margins, analysts found it challenging to justify a premium valuation for Casper. The situation underscores the necessity of not just growing, but growing wisely with a cost structure that allows for sustainable profitability.

Casper was a low growth, inefficient “money pit” business — if you want a deeper dive into what this means, please read my prior blog post on the topic.
Margin targets are not one-size-fits-all and should be reflective of the company’s unique operational realities. A company that targets unit contribution margins of 10% cannot realistically aspire to suddenly achieve long-term company net profit margins of 30%+ without significant changes to its business model, investment approach, and cost management strategies.
Conclusion
The true measure of a company’s financial health extends beyond LTV/CAC ratios to a thorough understanding of contribution margins as well. This comprehensive approach provides a clearer picture of profitability and strategic direction. It reveals that a company’s ability to maintain high margins is indicative of quality and potential for sustainable growth.
Note: Elements of the financial terminology used in this post has been simplified for ease of understanding.
Special thanks to my colleagues Matt Sherman, Sam Bauman, and Amit Bhatt for their feedback on this post.


